


")


Energy Meter Data Analysis and Reporting Template
excl. VAT.
We have created an Excel spreadsheet that can analyse and visualise data logged by energy usage logging meters. This file can be used as a template to be used repeatedly to analyse your energy logging data and to create reports. Import the .CSV (comma-separated values) in this Excel template and create graphs and tables in this template.
Would you like to be notified when this item is back in stock? Then please fill in the following form:
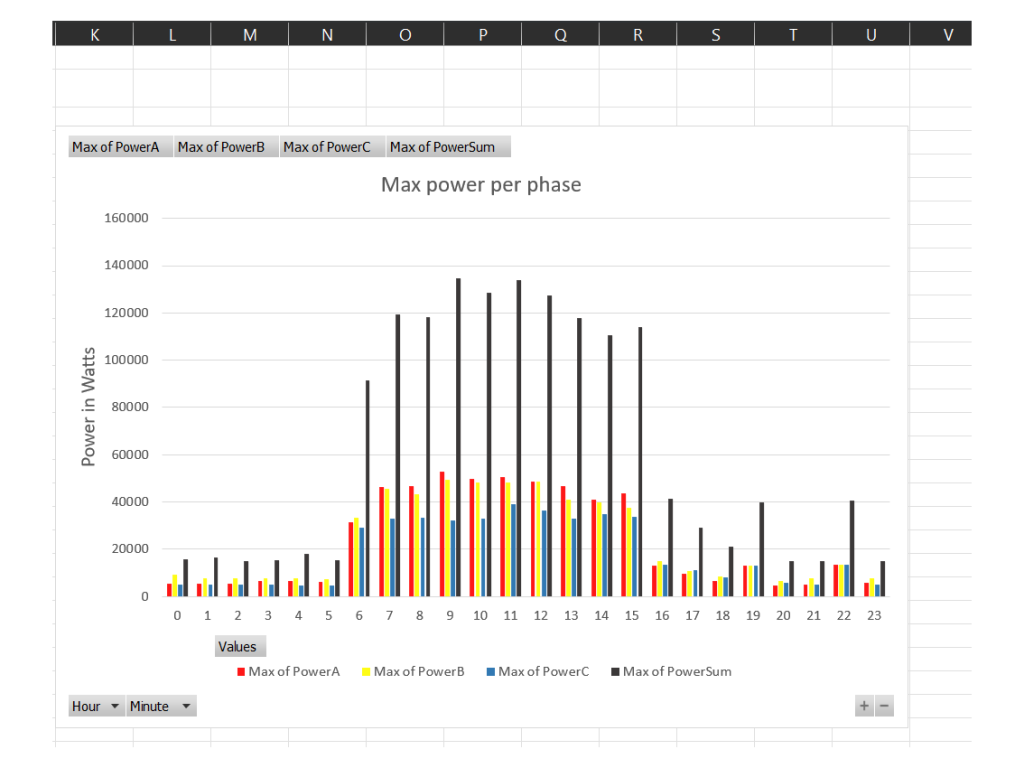
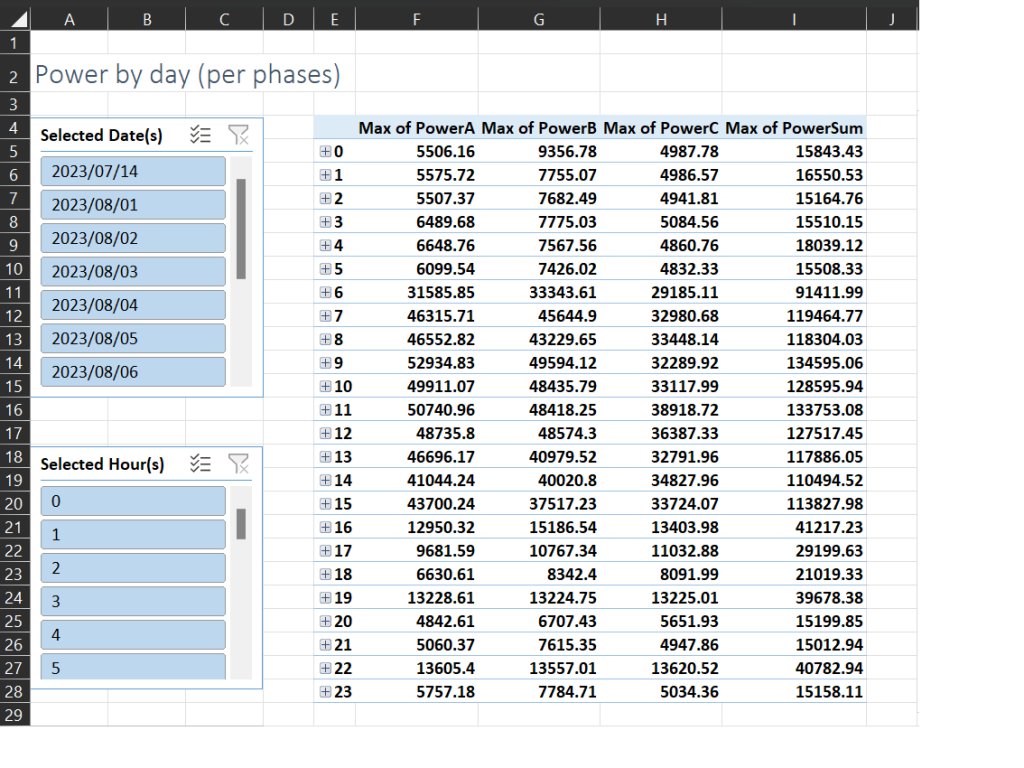
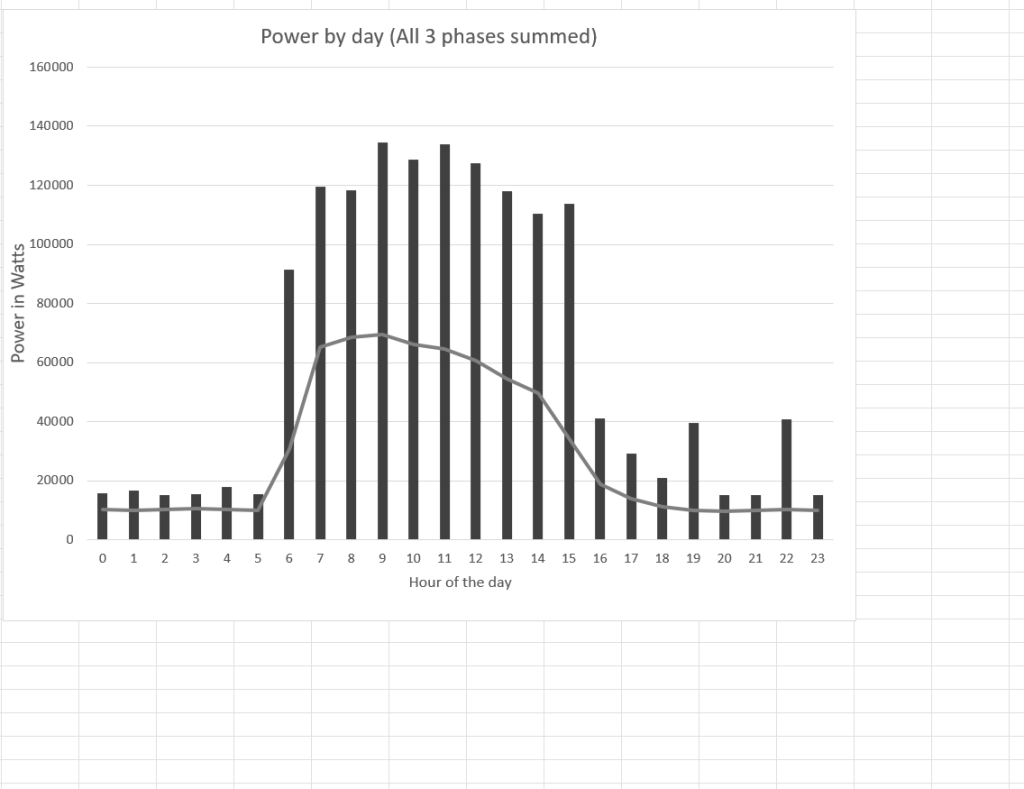
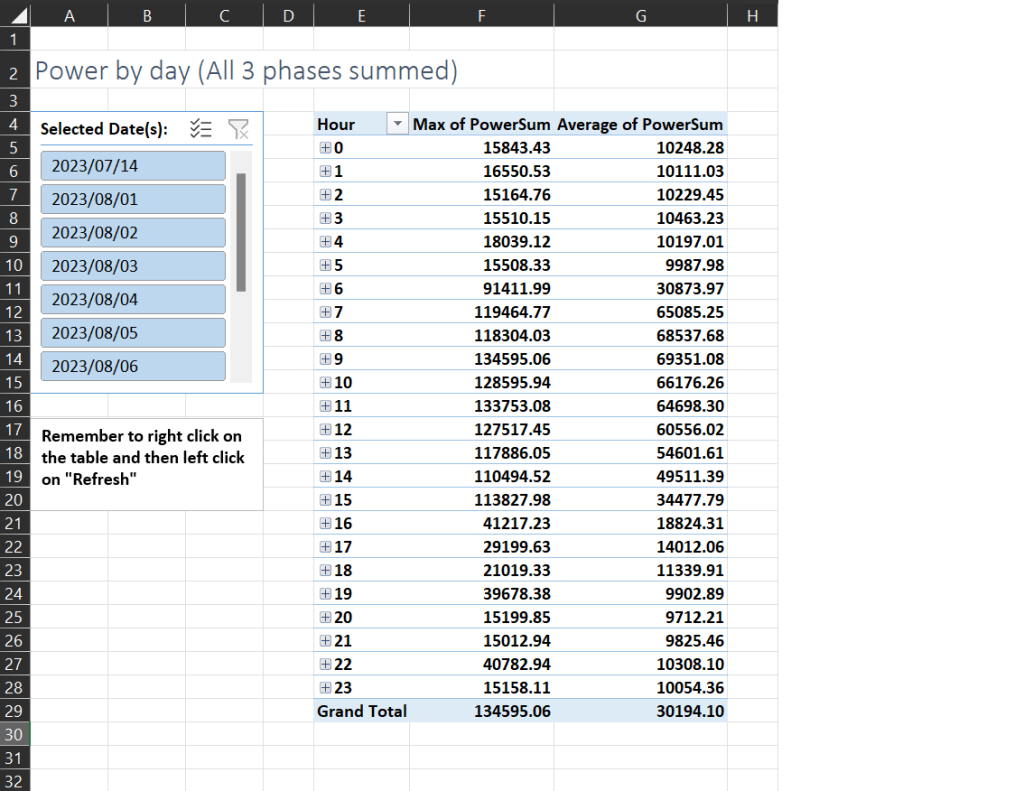
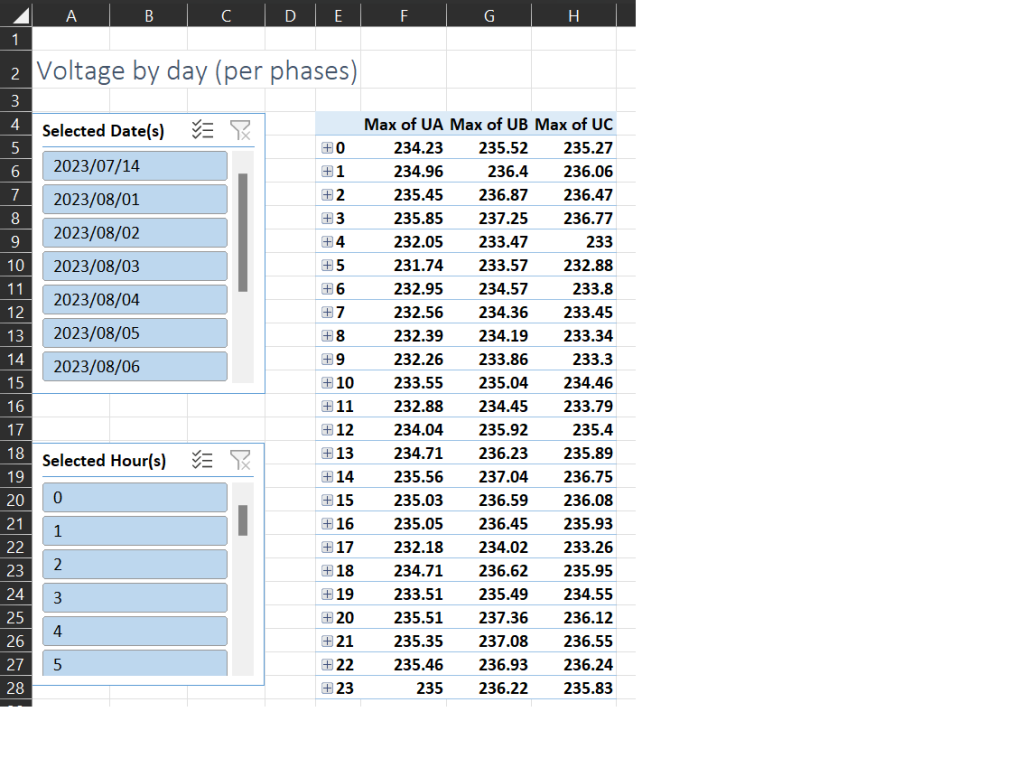
Data visualised
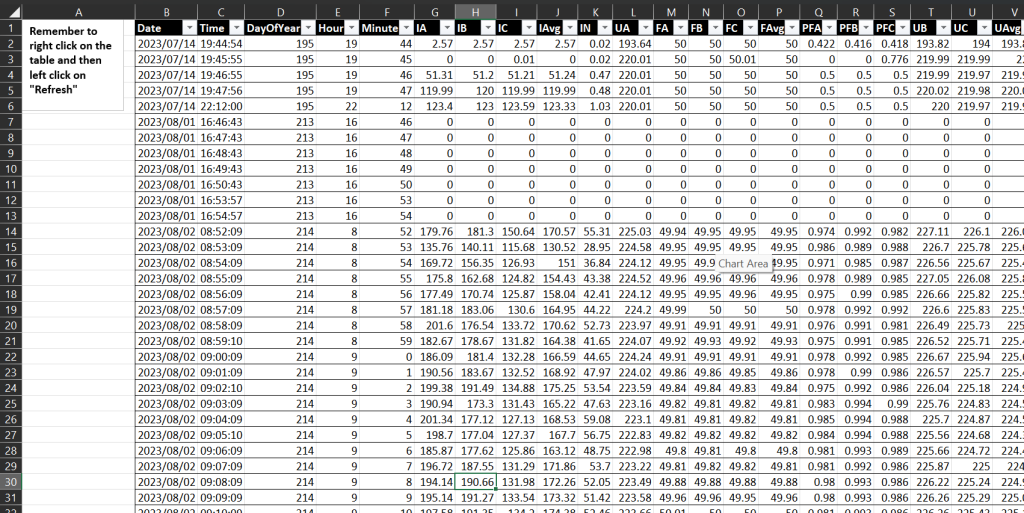
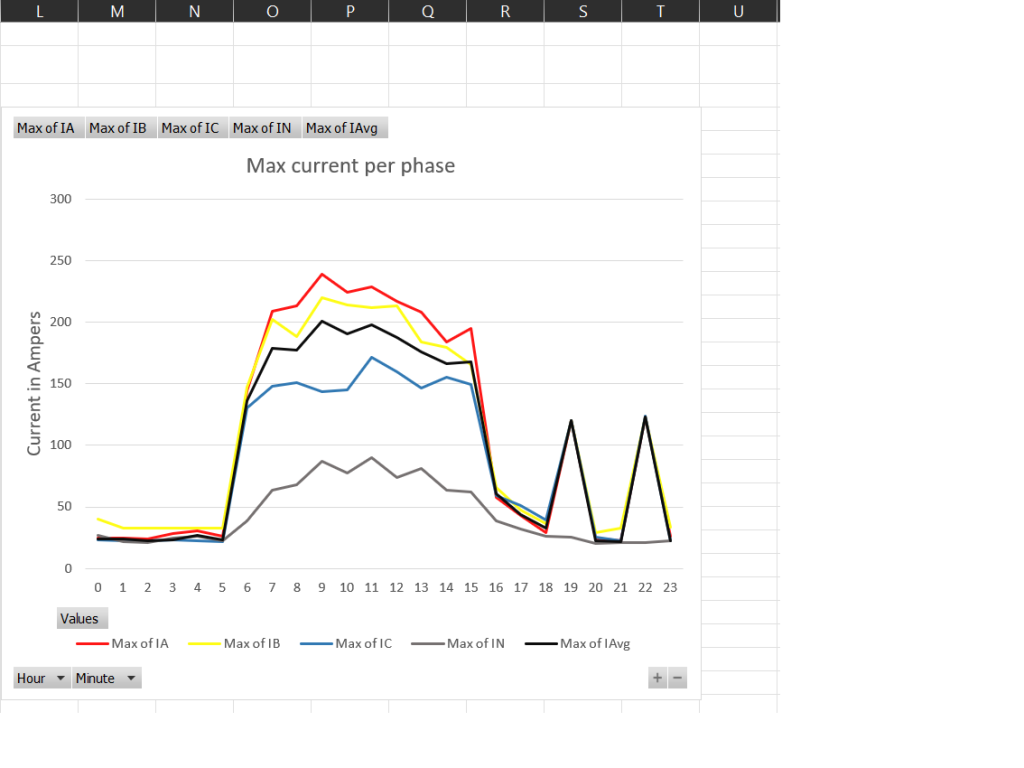
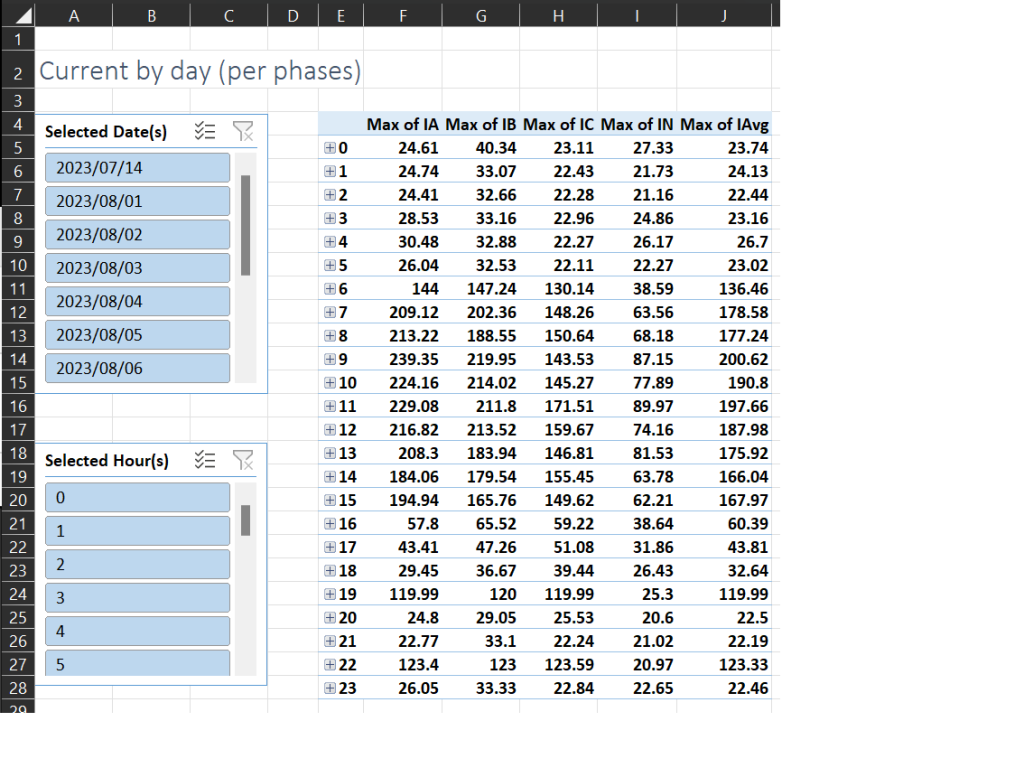
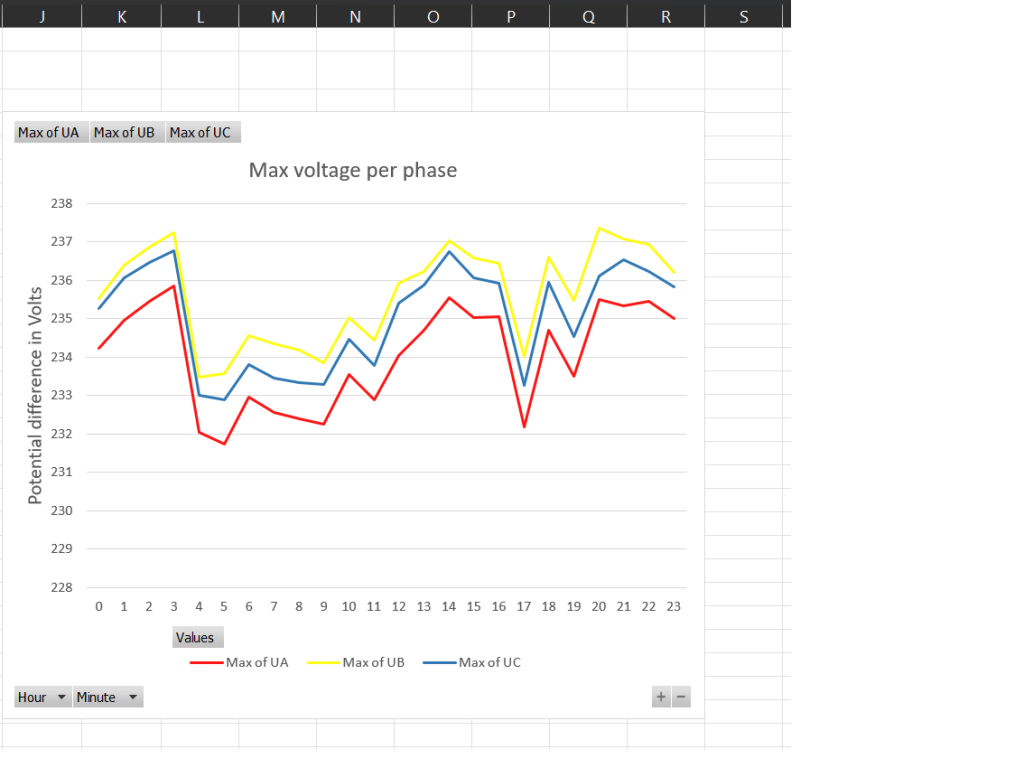
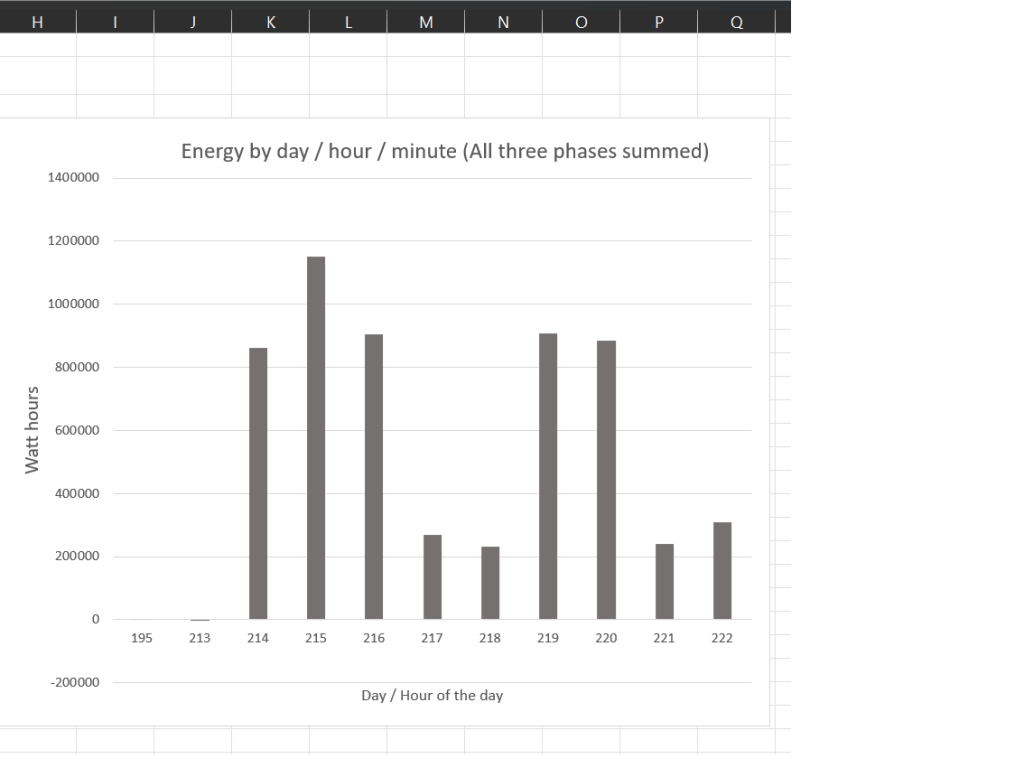
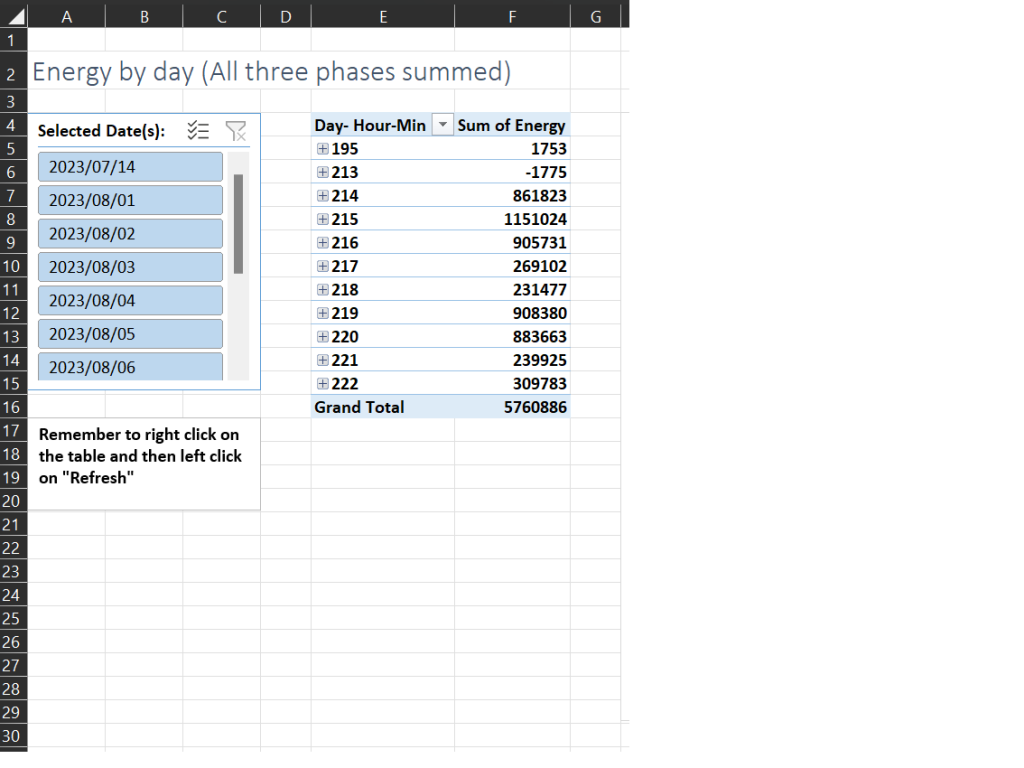
- Energy per minute, hour, day and week
- Peak power per minute, hour, day and week
- Peak power per phase per minute, hour, day and week
- Maximum voltage per minute, hour and day
- Maximum current per minute, hour and day
Features
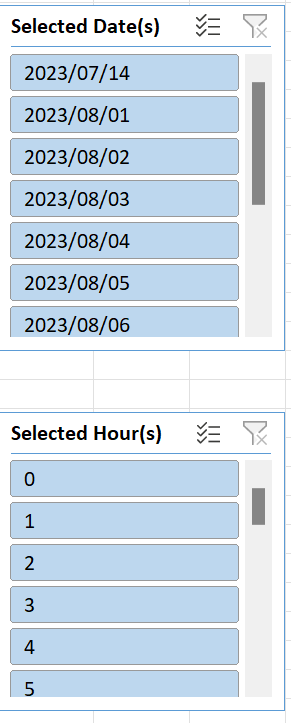
- Limit data displayed to a specific day or hour
- Supports three-phase and single-phase setups
- Support any brand energy meter, send us your data and we will change the template to be compatible with your data.
Once you have paid for this service, we will email you a link where the template can be downloaded and instructions on how it works.
Compatibility
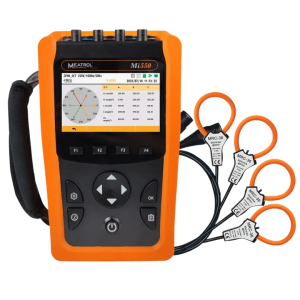
The template can analyse data from any Meatrol Energy logger, for example, the Mi550, ME440, ME435 and ME238.
If you would like to analyse data from any other energy logger, please get in touch with us and we will adapt the template to your data.
What is included
- Three phase data analysis Excel template
- Single phase data analysis Excel template
- Instruction document and videos.
- One hour remote support on WhatsApp or Video.
Instructions and Support
We offer remote support to help you with any problems importing or analysing the data. We support a variety of remote support software tools such as Skype, Teams, TeamViewer and AnyDesk. Additionally, we also have this instructional page and videos.
For instruction videos, documents and support click here
Template demonstration video
Related products
-
 €1.500,00